Plastic is the material we can’t seem to live without — and, increasingly, the material we can’t safely live with either. Nowhere is that tension clearer than in PET (polyethylene terephthalate), the plastic behind most water bottles, soft drink containers, and food packaging on the planet, and its recycled counterpart, rPET. Global plastic production has climbed past 450 million tonnes a year, up from just 2 million tonnes in 1950, and the packaging that PET dominates is a huge part of that growth.
This article breaks down what PET and rPET actually are, how their environmental footprints compare, and — most importantly — what happens when plastic is produced faster than it can be safely collected, recycled, or disposed of. In 2026, with a global plastics treaty still unresolved and microplastics turning up in human blood and organs, that question has never mattered more.
What Is PET Plastic?
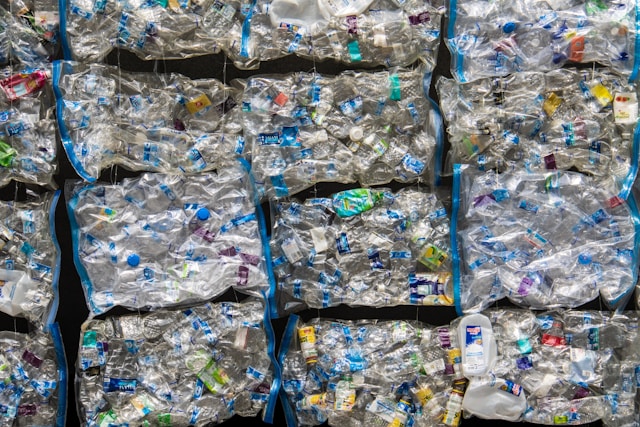
PET, sometimes written PETE, is a lightweight, durable, and transparent thermoplastic made from crude oil and natural gas. Chemically, it’s a polyester formed by combining purified terephthalic acid with ethylene glycol, and it’s identified on packaging by the resin code “1” inside a triangle. Because it’s strong, shatter-resistant, and doesn’t react with food or drink, PET became the default choice for bottled water, soda, cooking oil, shampoo, and countless other consumer products.
That same durability is the root of the problem. A material engineered to resist degradation for the sake of shelf life becomes a material that resists degradation for centuries once it’s discarded — long after its useful life as a bottle or container has ended.
What Is rPET, and How Is It Made?
rPET stands for recycled polyethylene terephthalate. Instead of being manufactured from virgin fossil fuel feedstocks, rPET is created by collecting, sorting, washing, and grinding post-consumer PET — think used water bottles — into flakes or pellets, which are then reprocessed into new bottles, textiles, carpeting, or packaging.
There are two main recycling routes:
- Mechanical recycling — shredding, washing, and re-melting plastic. It’s cheaper and more widely available, but repeated cycles can degrade the polymer, leaving it slightly brittle or discolored.
- Chemical recycling — breaking PET down to its molecular building blocks and rebuilding it, producing near-virgin-quality resin at a higher cost and with less industrial availability.
Because PET is thermoplastic, it can, in theory, be melted and reshaped indefinitely — which is exactly what makes a genuine circular economy for this material possible, at least on paper.
PET vs rPET: Comparing the Environmental Footprint
On a molecular level, PET and rPET are nearly identical. Environmentally, they are not.
- Energy use: producing rPET takes roughly 79% less energy than manufacturing virgin PET.
- Carbon footprint: rPET generates around 0.45 kg of CO2 per kilogram of plastic, compared with 2.15–2.5 kg of CO2 per kilogram for virgin PET — a difference of roughly 80%.
- Resource extraction: virgin PET depends on continued extraction of crude oil and natural gas; rPET diverts existing waste instead of drawing down new fossil resources.
- Trade-offs: rPET can have a faint gray or blue tint and slightly reduced clarity, and high-quality, food-grade rPET is often in short, competitive supply — sometimes making it more expensive than virgin resin despite its lower environmental cost.
Encouragingly, regulation is starting to close that cost gap. The UK’s Plastic Packaging Tax and similar EU measures now penalize packaging with low recycled content, while several jurisdictions are phasing in mandatory minimum recycled-content rules for bottles through 2030. Even so, industry data shows recycled-content growth in PET bottles has flattened since 2024 as the “easy wins” from early regulation have already been captured — a sign that voluntary progress alone won’t be enough.
The Scale of the Global Plastic Problem in 2026
The raw numbers behind plastic production and disposal are worth sitting with:
- Global plastic production is now estimated at over 400–450 million tonnes annually, and could nearly triple to around 1.2 billion tonnes by 2060 under a business-as-usual scenario.
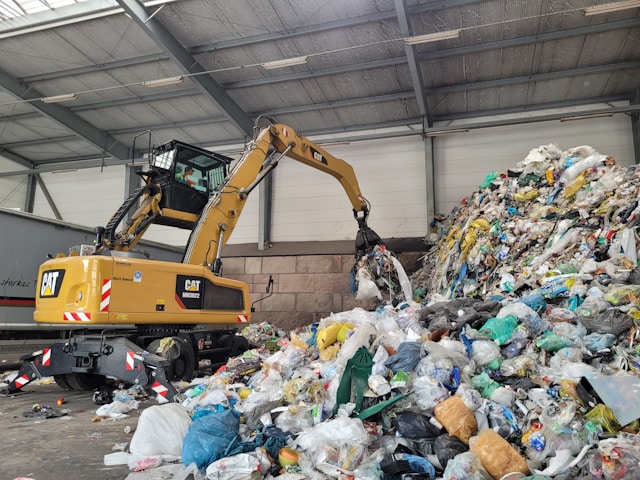
- Of all the plastic ever manufactured, only about 9% has ever been recycled. Roughly 12% has been incinerated. The rest — nearly 80% — has piled up in landfills or leaked directly into the natural environment.
- Around half of all plastic produced is designed for single use, meaning a product with a working life measured in minutes can leave a footprint that lasts for generations.
- Under current trends, mismanaged plastic waste is projected to roughly double between 2019 and 2040.
Where Does It All Go? Accumulation in Landfills, Rivers, and Oceans
Landfills and soil contamination
Once buried, PET doesn’t quietly disappear. Estimates for full decomposition commonly range from roughly 450 years to well over 700 years, during which buried plastic can leach chemical additives into surrounding soil and, over time, into groundwater supplies.
Rivers as delivery systems to the sea
Most ocean plastic doesn’t start in the ocean — it starts on land and travels there. Research consistently finds that just around 1,000 rivers are responsible for roughly 80% of the plastic pollution that reaches marine environments, with the bulk of that volume flowing from regions where waste-collection infrastructure hasn’t kept pace with rising consumption.
The ocean’s growing plastic burden
Estimates of how much plastic currently sits in the ocean vary considerably depending on methodology — from roughly 75 to 199 million tonnes accumulated to date, with newer annual-input estimates ranging from around 1–2 million tonnes a year on the more conservative end up to the UN Environment Programme’s estimate of 19–23 million tonnes leaking into aquatic ecosystems — rivers, lakes, and seas combined — every year. Whatever the precise figure, the direction is the same: accumulation, not decline.
The best-known symbol of this crisis, the Great Pacific Garbage Patch, continues to grow, and abandoned “ghost” fishing gear — nets, lines, and traps — makes up a disproportionate share of the danger to marine life, with only around 2% of ghost gear recovered each year.
Bad Disposal: Open Burning, Illegal Dumping, and Informal Settlements
Where formal waste collection is patchy or absent, plastic doesn’t just accumulate — it’s often burned in the open, dumped in waterways, or left in informal settlements. Open burning of plastic waste releases dioxins and other toxic pollutants directly into the air people breathe, and health impacts tied to plastic production and improper disposal — including heart disease, asthma, and cancer — are projected to rise by around 75% by 2040 if current practices continue.
Nairobi’s own Dandora dumpsite illustrates the problem at ground level: a roughly 46-hectare site absorbing a share of the 3,500 tonnes of waste the city generates daily, much of it beyond what existing infrastructure can properly process. Plastic waste that clogs drains and wetlands in cities like Nairobi has also been shown to intensify urban flood damage during heavy rains, turning a waste-management issue into a public-safety one.
Microplastics and Nanoplastics: The Hidden Health Danger
Plastic doesn’t need to be visible to be dangerous. Sunlight, friction, and time break PET and other plastics into microplastics (under 5mm) and even smaller nanoplastics, which are now essentially everywhere — in soil, drinking water, the air, and the food chain.
What’s newer, and more unsettling, is where scientists are now finding these particles: inside us. Researchers have detected microplastics circulating in human blood and lodged in at least 15 different human tissues and biological compartments, including the liver, spleen, lungs, colon, placenta, and breast milk.
Human research on health effects is still young and largely observational, but a growing body of evidence is raising real concern:
- In the gut, microplastics have been associated with intestinal inflammation and disruption of the gut microbiome, potentially raising the risk of metabolic disorders.
- Systematic reviews rate the evidence linking microplastic exposure to reduced sperm quality and digestive-tract immune suppression as comparatively strong, with moderate-quality evidence also pointing to effects on female reproductive hormones and respiratory function.
- Emerging research is examining how microplastic exposure across a lifetime may affect reproduction, fetal development, and biological aging.
- Mechanistic studies point to oxidative stress, chronic inflammation, and hormonal and immune disruption as plausible pathways, though researchers are careful to note that most of this evidence still comes from animal and cell-culture studies rather than confirmed human clinical outcomes.
Scientists broadly agree on two things: exposure is real and rising, and there is currently no established medical way to remove microplastics once they’ve accumulated in the body — which makes preventing further contamination at the source the only real lever we have.
(This is a factual, research-focused overview of an environmental health topic. If you have personal health concerns related to plastic exposure, it’s worth raising them with a doctor rather than relying on general information like this.)
Impact on Wildlife and Ecosystems
Plastic pollution isn’t an abstract statistic for marine life — it’s a daily hazard. More than 700 marine species have been documented ingesting plastic, becoming entangled in it, or living in habitats contaminated by it. An estimated 52% of the world’s sea turtles have eaten plastic debris at some point, often mistaking bags and fragments for food. Filter-feeding whales may unknowingly consume millions of plastic particles a day during feeding season simply by processing normal volumes of seawater. Abandoned fishing gear, meanwhile, continues to entangle and kill marine mammals and turtles long after it’s lost at sea.
The Global Response: Treaties, Regulations, and a Push Toward Circularity
Governments have known about this crisis for years — turning that awareness into binding rules has proven far harder.
Since 2022, the UN’s Intergovernmental Negotiating Committee has been working toward a legally binding global plastics treaty covering production, design, and disposal across plastic’s full lifecycle. Talks in Busan (2024) and Geneva (2025) both ended without agreement, largely over whether the treaty should cap plastic production or focus solely on waste management. A new committee chair was elected in February 2026 to try to restart the process, but as of mid-2026 no final treaty text has been adopted.
In the meantime, national and regional policy is moving on its own track: extended producer responsibility (EPR) laws are spreading, requiring companies to help fund collection and recycling of the packaging they sell, and deposit-return schemes and recycled-content mandates are becoming more common across the EU, UK, and beyond.
Kenya offers one of the more instructive case studies in this space. The country banned single-use plastic bags in 2017 and later extended restrictions to protected natural areas. More recently, the Kenya Plastics Pact published a roadmap to make all plastic packaging in the country reusable or recyclable by 2030, and in early 2026 the government launched a Plastic Circular Investment Initiative to attract financing for recycling infrastructure and formalize the informal waste-picker economy that currently does much of the collection work. Organizations like TakaTaka Solutions have shown, at Nairobi’s Dandora dumpsite and beyond, that better sorting at the source can meaningfully divert plastic away from landfills even where formal recycling infrastructure is still developing.
Why rPET and the Circular Economy Still Matter
None of this means recycling is a silver bullet — production caps, redesign, and genuine waste reduction all matter more than recycling alone. But within that bigger picture, rPET plays a real and measurable role: every tonne of recycled PET used in place of virgin resin is a tonne of fossil-fuel extraction avoided, energy demand cut by roughly three-quarters, and plastic diverted from a landfill or waterway. As mandatory recycled-content laws expand and brands compete on sustainability credentials, demand for high-quality rPET is likely to keep growing — provided collection and sorting infrastructure, especially in fast-growing markets, can keep up.
What Individuals, Businesses, and Communities Can Do
- Cut single-use plastic where you can — reusable bottles, bags, and containers reduce demand at the source.
- Sort waste properly — contamination is one of the biggest reasons recyclable PET ends up in landfills instead of recycling facilities.
- Choose products with verified recycled content rather than vague “eco-friendly” claims.
- Support deposit-return and buy-back schemes where they exist, since these are consistently linked to higher collection rates.
- Back local recycling and waste-picker formalization efforts, which do the unglamorous work of keeping plastic out of dumpsites and waterways in the first place.
- Push for extended producer responsibility policies, which shift some of the cost of end-of-life plastic management back onto the companies that produce it.
Conclusion
PET and rPET are, chemically, almost the same material — but the choice between them carries real environmental weight: roughly 80% less energy, a fraction of the carbon footprint, and one less tonne of virgin plastic pulled from the ground. The bigger issue, though, isn’t PET versus rPET. It’s what happens to plastic — of any kind — once we’re done with it. With only about 9% of all plastic ever recycled, a global treaty still unresolved, and microplastics now showing up in human blood, 2026 is a year in which “away” has stopped being a place plastic can safely go.